
Creating genome feature heatmaps from sequencing experiments
These types of figures are best created using the ngsplot software package.
Before that code was released, we used the method describe below:
This type of figure can be used to visualize chIP or expression expression data in selected genome regions (rows) that have been divided into windows (columns) using either similar or relative feature widths.
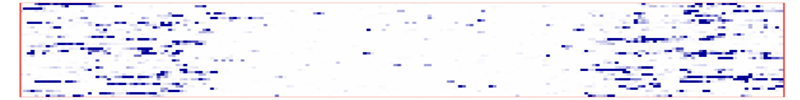
Sample image:

- Create a BED file with all the regions you'd like to display.
- Create a SAM/BAM file by mapping your reads with a tool like bowtie or tophat.
- Split the regions you'd like to display into windows,
- labeling each window in a systematic way
- Region 1 would include windows REGION_01_001 ... REGION_01_100
- Region 2 would include windows REGION_02_001 ... REGION_02_100, etc.
- The BaRC script /nfs/BaRC_Public/BaRC_code/Perl/split_genome_regions_into_windows.pl can do this.
- labeling each window in a systematic way
- Quantify reads that map to each window of each region.
- Method 1: Use coverageBed (ex: coverageBed -split -abam accepted_hits.bam -b region.windows.bed > out)
- Method 2: Use htseq-count (after converting region.windows.bed into a GTF file)
- Method 3: Use cufflinks (after converting region.windows.bed into a GTF file)
- Convert list into matrix (with code such as /nfs/BaRC_Public/BaRC_code/Perl/convert_coverageBed_output_to_matrix.pl) like
| NAME | 1 | 2 | 3 | 4 | 5 | 6 |
|---|---|---|---|---|---|---|
| REGION_01 | 0 | 11 | 13 | 3 | 0 | 0 |
| REGION_02 | 14 | 16 | 11 | 11 | 5 | 44 |
| REGION_03 | 1 | 0 | 0 | 0 | 0 | 20 |
- Add another column at the beginning with the same region IDs and save the tab-delimited text file with a cdt extension.
- Open the cdt matrix file in Java TreeView, adjust the pixel settings and print the figure.
Attachments (1)
- sample_genome_feature_heatmap.png (44.3 KB ) - added by 13 years ago.
Download all attachments as: .zip
Note:
See TracWiki
for help on using the wiki.